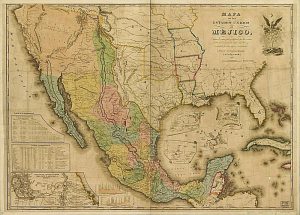
 For the better part of a century, the southern US border was open, more or less, and people moved back and forth as need or desire dictated. From our friends at Balloon Juice, two maps and a few more words:
You’ll notice that on both the map prepared for the negotiations of the Treaty of Guadalupe Hidalgo and the Rural Health Information’s map of Hispanic or Latino population of the US based on the 2010 Census that the area that the US would get from Mexico in 1848 is still where the largest percentage of the Hispanic or Latino population of the US live. This doesn’t count south Florida, which has a different historic pattern of Hispanic settlement. What the patterns of settlement shown on the maps show us is that the border was moved on the map, but the pattern of settlement remained largely unchanged.
Reckoning with the reality of steady demographics in this vast region despite changing borders or enforcement regimes is a prerequisite to sustainable immigration policy. It will come as a great surprise to many people that we can have a population that loves the land even if they call it something different and/or the name changes from time to time. I know: shocking.
